PHYS S-12 : Dan's Documentation
Electronic Input
Today in class we learned about varius kinds of sensors. This inspired to include many of them in my final project. If you want to read more about how I plan on integrating these sensors into my hot air ballon, please go to my final project page.
Contents
Feel free to skip around with these:
Thermistor
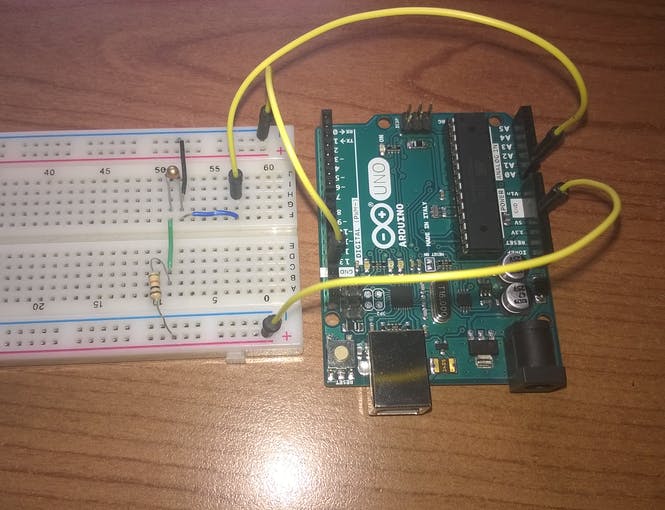
The type of thermistor I'm using is called an NTC (Negative Temperature Coefficent), which means that its resistance decreases as temperature rises. At first, I followed this guide to hook up my thermistor. After a very frustrating half an hour, I realized that the tutorial was wrong. The following image is from the tutorial, and the signal pin is placed AFTER the thermistor. Needless to say I was very annoyed, but I did learn a lesson: never trust a random online blogger at first glance.
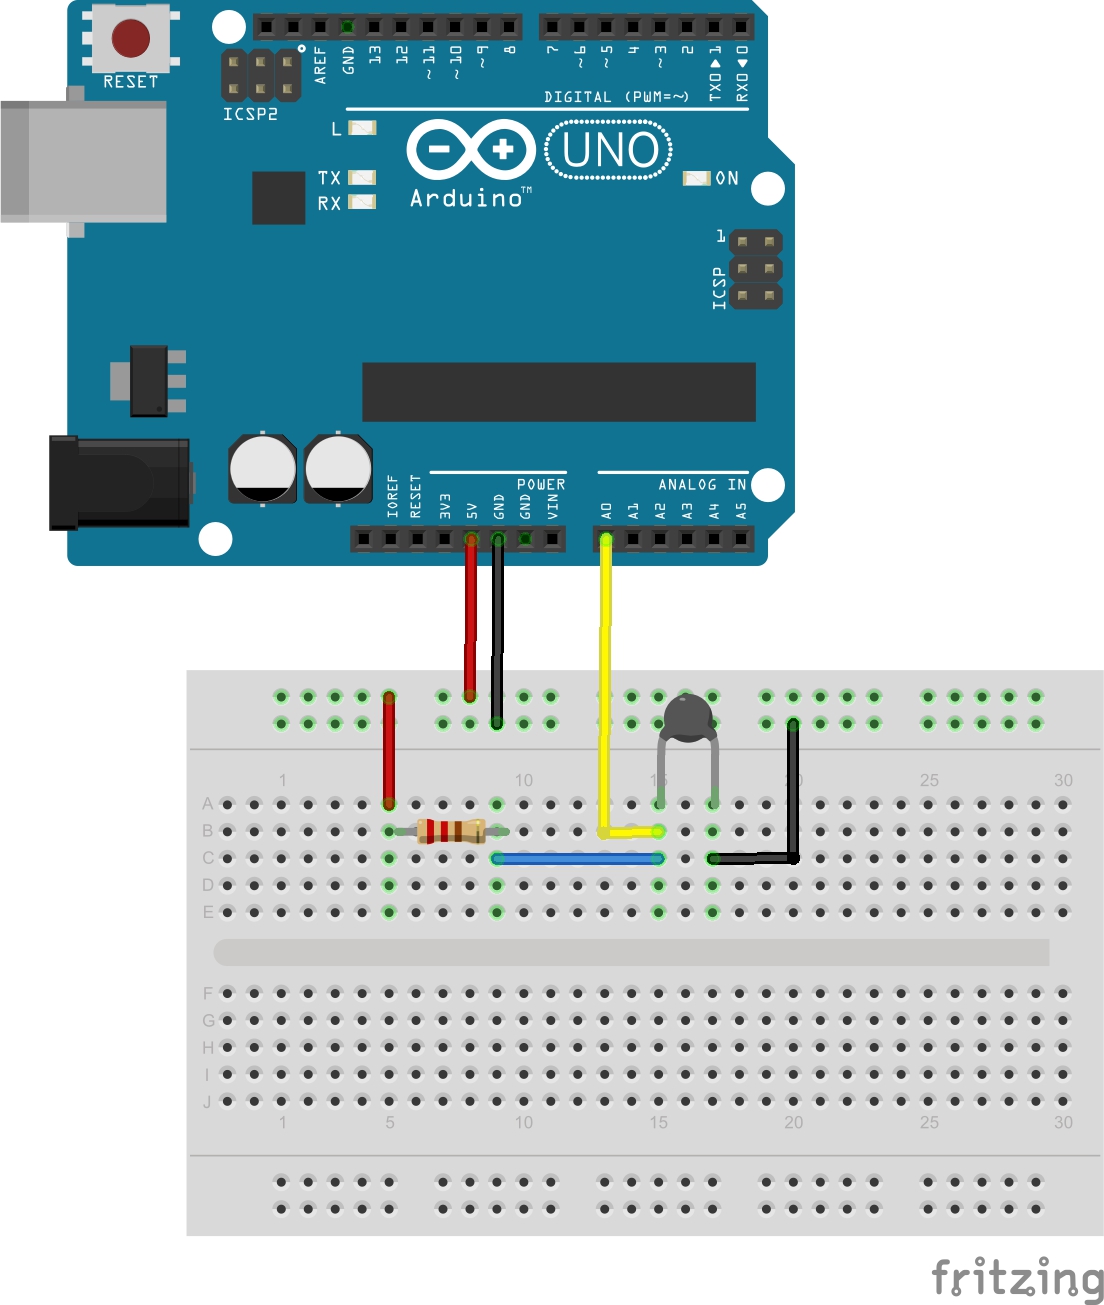
The correct layout is actually this (The resistor is 10k):
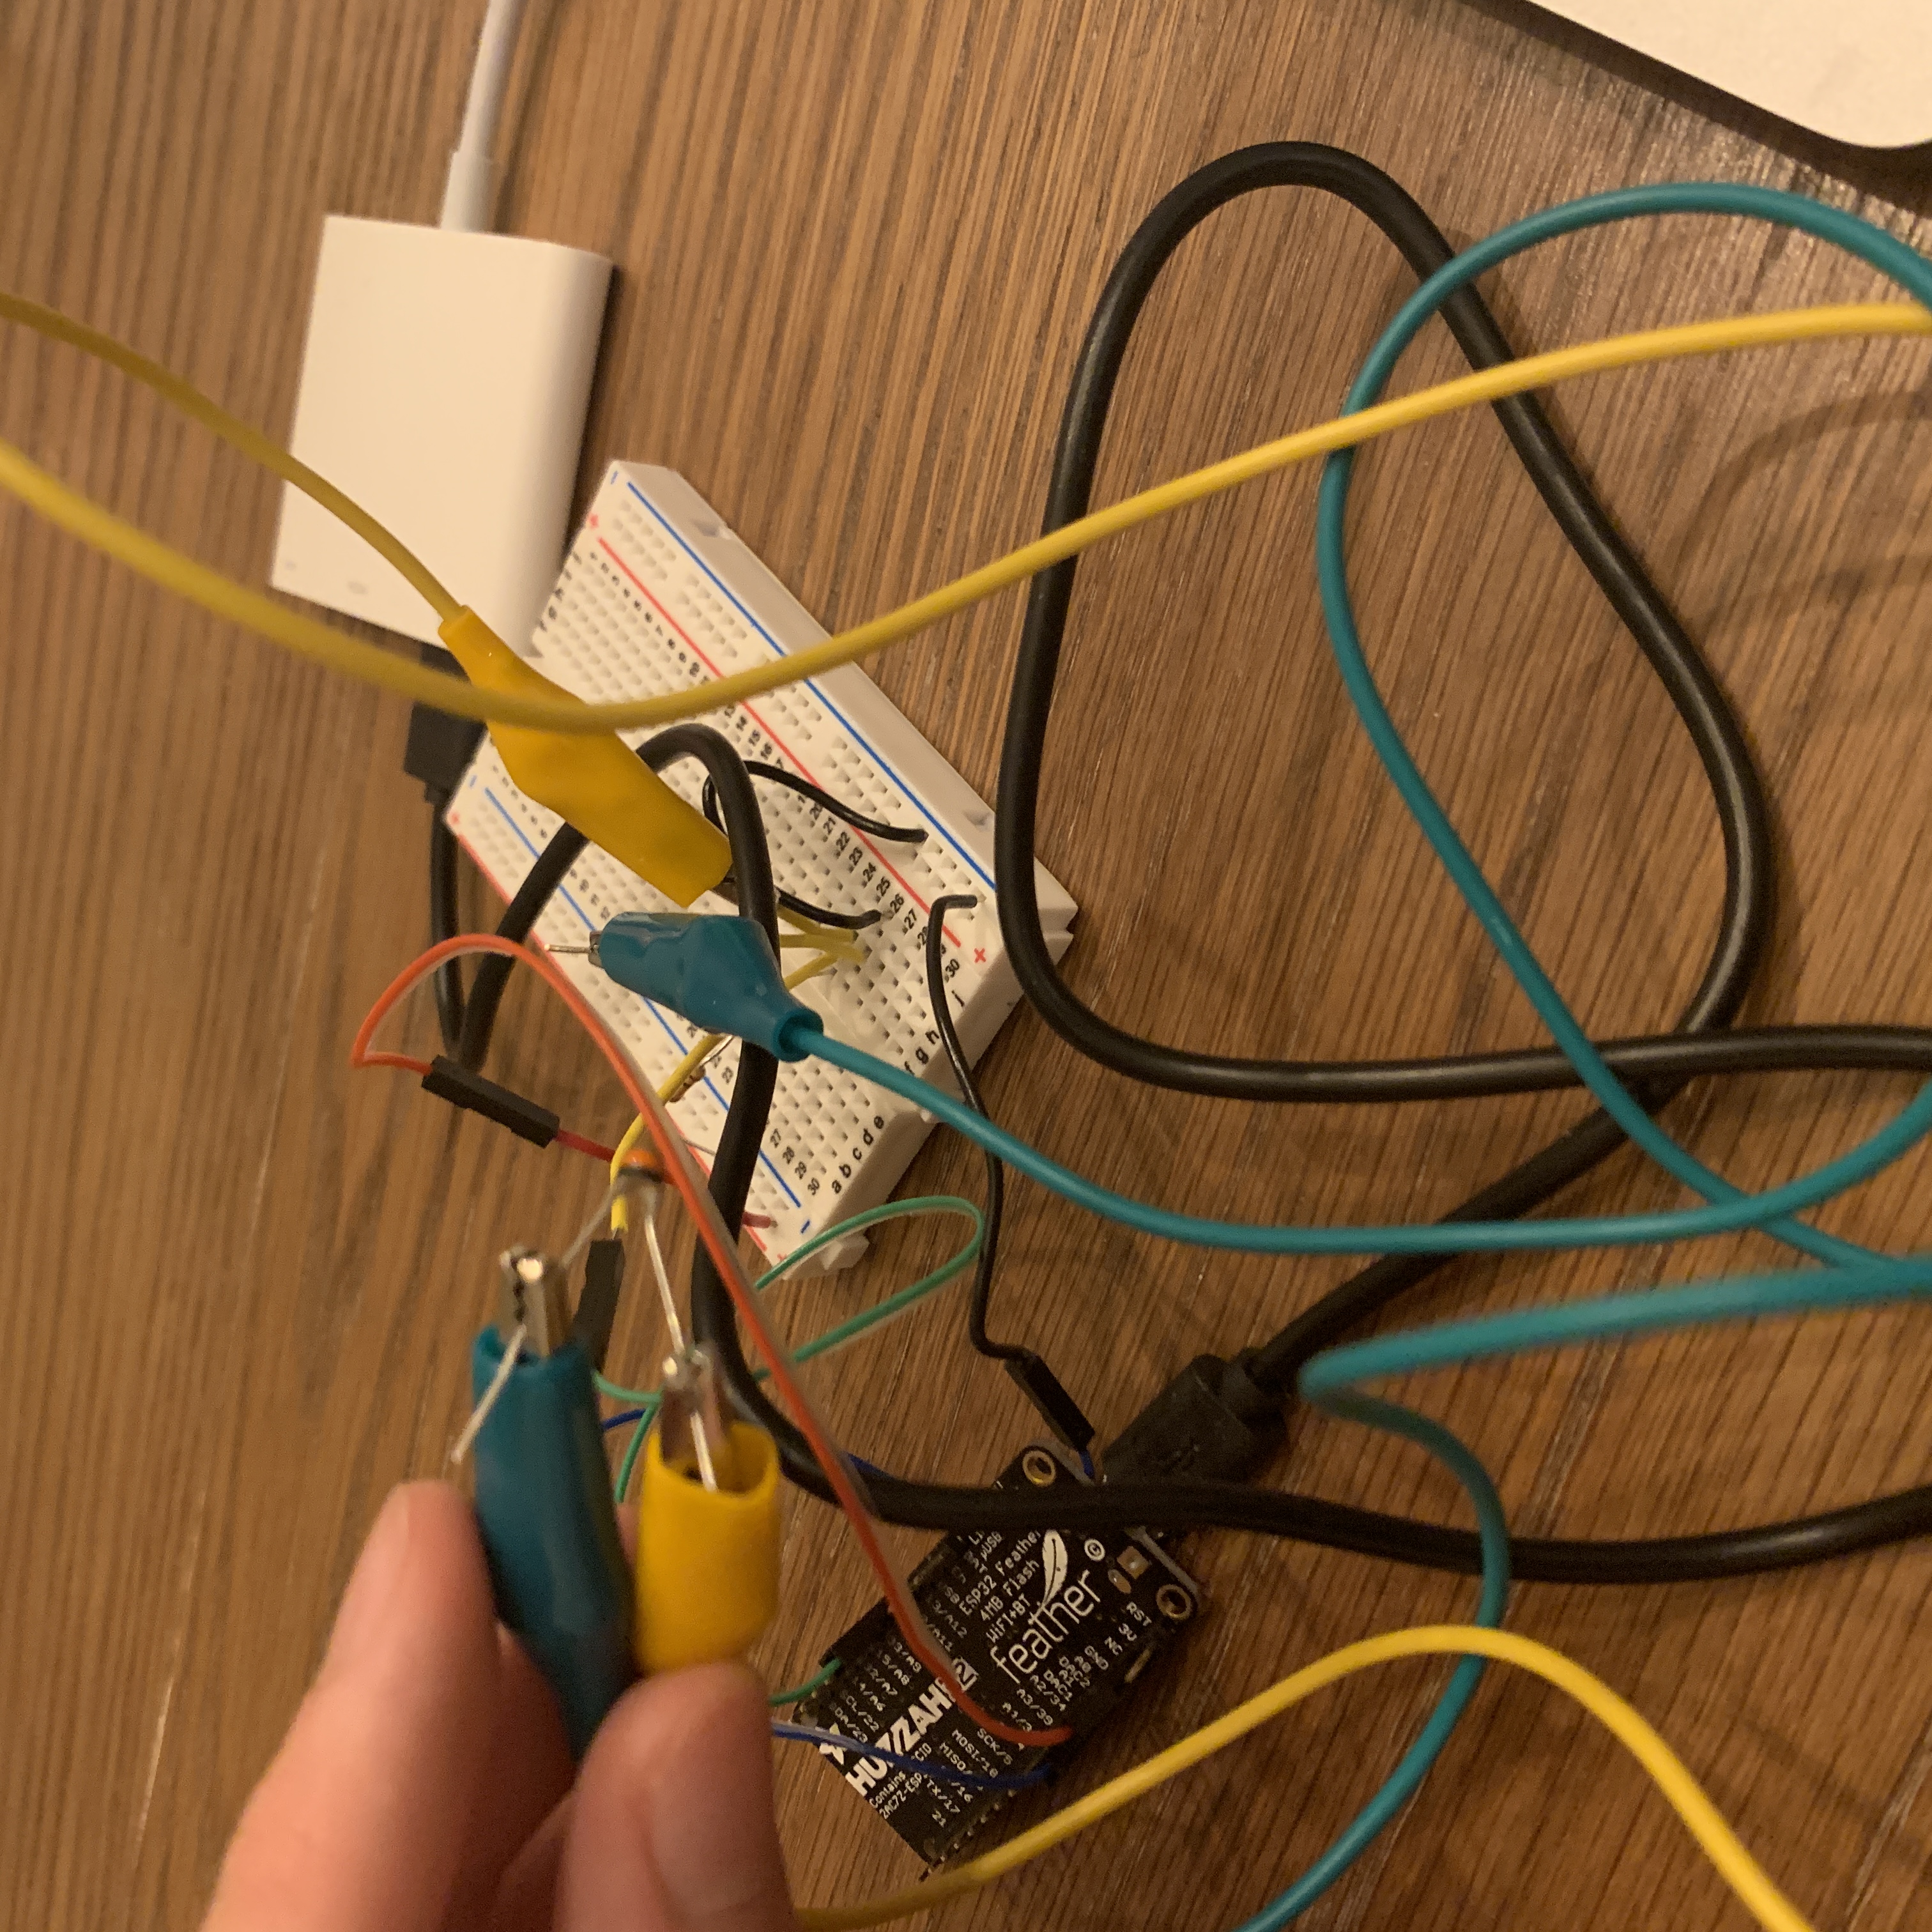
The only change I made was that I connected the thermistor to the circuit with aligator clips. This is so that I can test at high temperatures without burning the fragile electronics. Here is my setup:
After fixing my circuit, I tried multiple algorithms that converted the analog signal into temperature values. However, non of them were too close. The best one so far was Dr. Hart's algorithm found here, which was only off by 10 oC. Because of this, I decided to collect my own data. I would graph the effects of temperature on the resistance of the thermistor.
First step, transform the analog reading into resistance. This was explained very well to me in this guide. They basically combined the formula for voltage in a voltage divider and the relationship between voltage and analog readings. The resulting formula was…
R = 10K / (1023/ADC - 1)
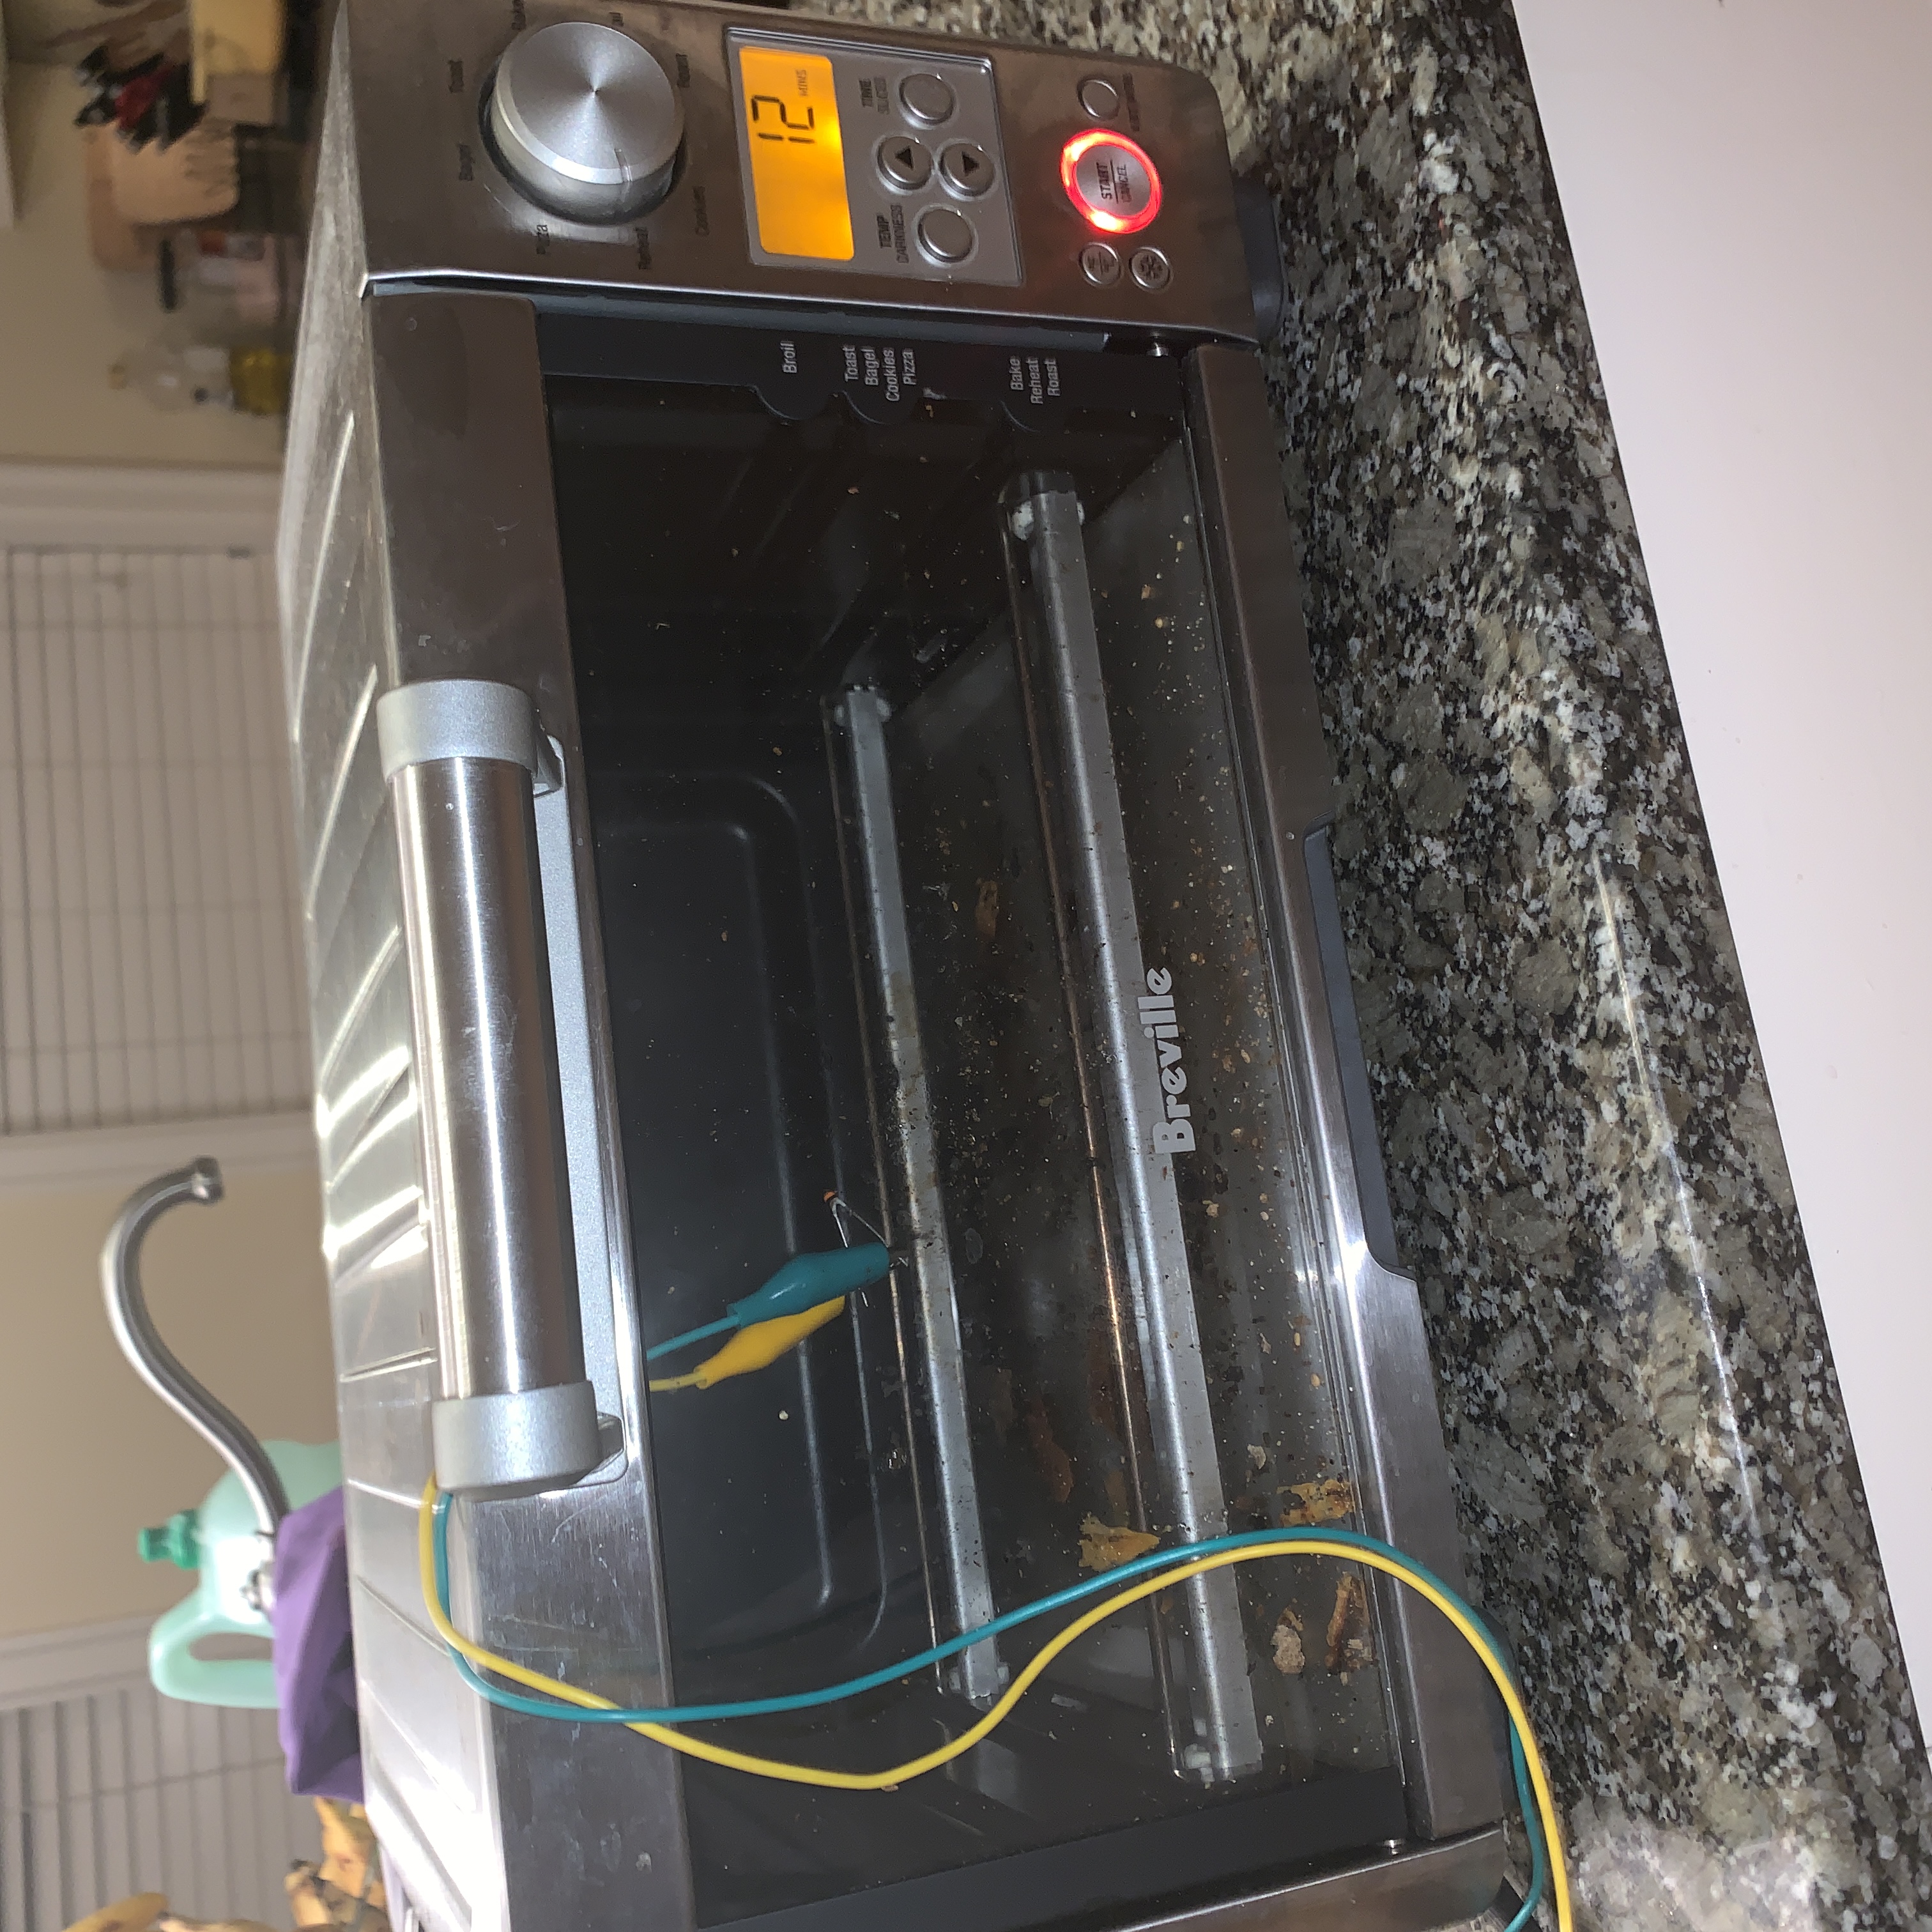
where ADC is the analog reading and 10k comes from the 10k resistor. Anyways, I moved my setup downstairs to the stove since I don't have a lighter.
Here is the code I'll be using. I adapted it from the same guide I used above.
// This code is adapted from:
// https://learn.adafruit.com/thermistor/using-a-thermistor, a program written by Limor Fried, Adafruit Industries

// the value of the 'other' resistor
#define SERIESRESISTOR 10000

// how many samples to take and average, more takes longer
// but is more 'smooth'
#define NUMSAMPLES 5

// What pin to connect the sensor to
#define THERMISTORPIN 13

void setup(void) {
  Serial.begin(9600);
  analogReadResolution(12);
}

void loop(void) {
  float average = 0;

  // take N samples in a row, with a slight delay
  for (int i=0; i< NUMSAMPLES; i++) {
   average += analogRead(THERMISTORPIN);
   delay(10);
  }
  average /= NUMSAMPLES;

  //Serial.print("Average analog reading ");
  //Serial.println(average);
  // convert the value to resistance
  average = 4095 / average - 1;
  average = SERIESRESISTOR / average;

  //Serial.print("Thermistor resistance ");
  Serial.println(average);

  delay(1000);
}
This code actually takes five separate readings and averages them in order to smooth out the noise.
Testing
I came up with a creative, albeit crude, method of controlling the temperature: an oven. I know… it sounds ridiculous, but it was the only tool I had at my disposal. So after making sure that I wouldn't start a fire, I went straight to testing.
I'm planning to test eleven different temperature from 50 (my oven's lowest setting) to 100 oC. I'll do two trials so that my data is more accurate. Since I am constantly getting data from the thermistor, each of my datapoints will be the average of all the readings within 5 seconds.
After nearly an hour of testing, I was getting suspicious at the fact that the data seemed to stay constant. I double checked my circuit, and it turns out that I WAS READING FROM THE WRONG PIN! So… after cursing at myself for a few minutes, I restarted the experiment.
Well, it took around three hours since my oven took at least five minutes to read a stable temperature for each datapoint, but I finally got the data.
Data
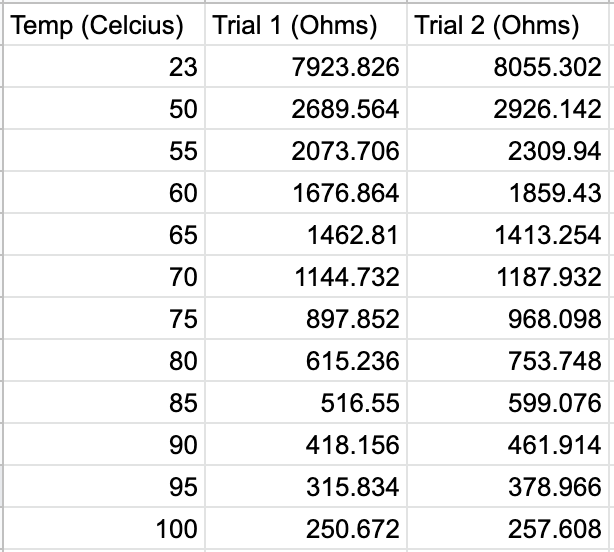
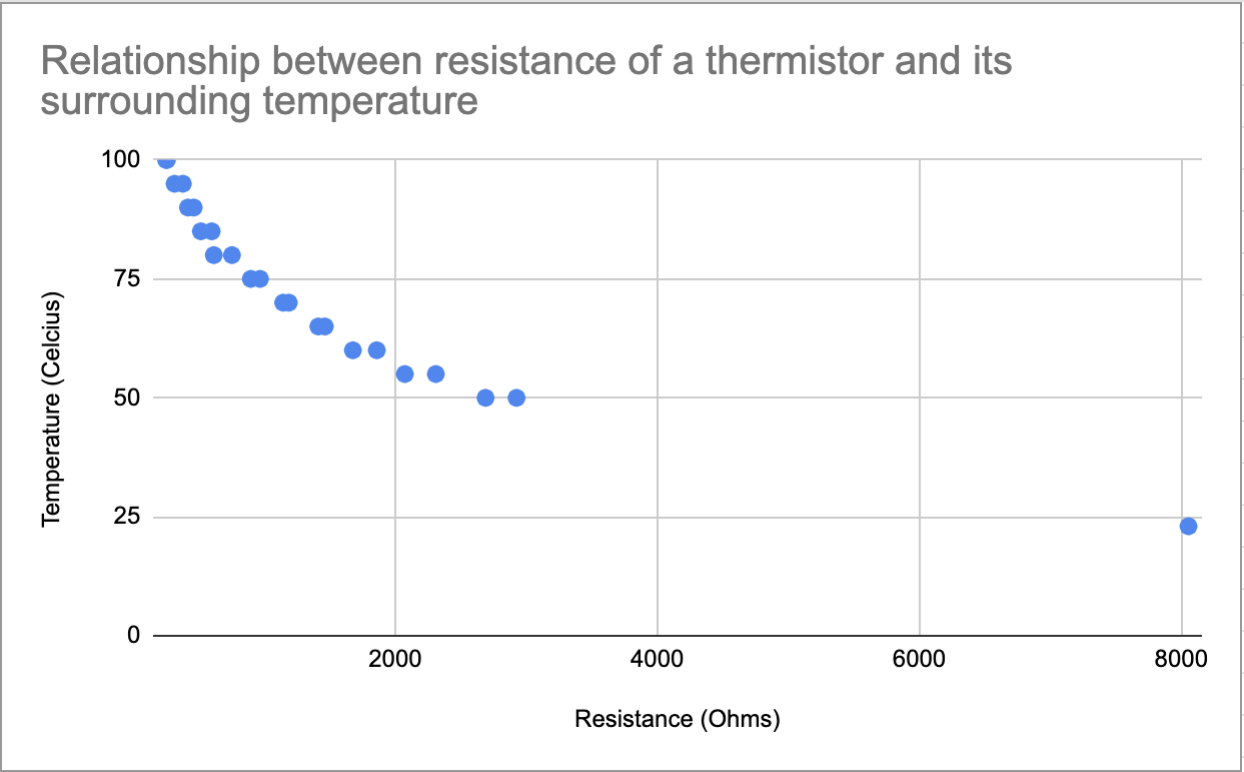
I then plotted the graph with resistance on the x axis and temperature on the y axis.
Linearization
Next step is to linearize the data. I can finally find a practical use for my precalc knowledge!
I've been told in class that the Thermistor's readings will be an exponential graph. My best guess at its function would be
Resistance = aeb*Temperature
where a and b are constants. A bit of algebra turns the above equation into
ln(Resistance) = b*Temperature + ln(a)
This means that the graph will be linear when graphed with the natural log of the resistance. Note that I'm plotting resistance as 'x' and temperature as 'y' (which is confusing considering that resistance is seen as 'y' in the equations above, however, just think of this as switching the axis), so I'm going to be transforming the data into the form of (ln x, y). Here's the linearized graph:
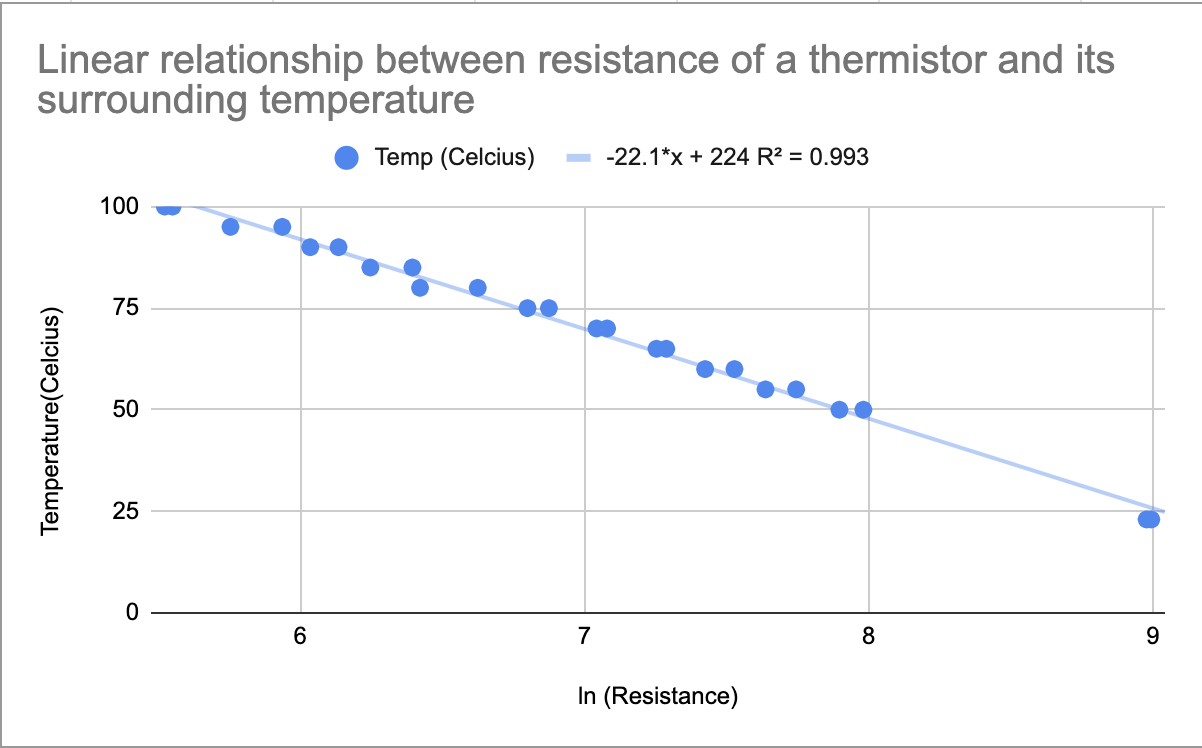
As you can see, the R2 value, which decides the usefulness of a graph, is nearly perfect (Best = 1). On top of that, I know that the model is also appropriate because thermistor resistance is said to have an exponential relationship with temperature.
Thanks to the "Trendline" feature of google sheets, I was able to easily get the LSR of the linear model. All I had to do was plug in "ln(Resistance)" into the LSR, and now I have a model for the temperature (oC) based on a thermistor's resistance (Ohms)!
Temperature = -22.1 * ln(Resistance) + 224
From now on, I will be able to calculate temperature as a function of the thermistor's resistance in my program. Below is this new relationship graphed alongside the datapoints collected during the testing.
Using the function
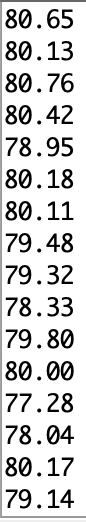
The next morning, I hooked up my thermistor once again and implemented what I had worked on with just one line: average = -22.1 * log(average) + 224;. Keep in mind that at this point in the code the "average" variable represents the resistance.
I went back to the oven one last time, and my temperatures readings matched the oven's temperature. The thermistor even accurately sensed the room temperature. There was at most a 2 degrees margin of error, so I consider this a successful calibration! Lastly, I have to acknowledge that my oven is not perfect at controlling its heat, but the margin of error is not too bad, and it's good enough for this application.
Self Fabricated Sensor
A decided to make a distance sensor with Capactive Sensing. A charged copper sheet will try to complete its circuit by sending electrons to ground. My "ground" element is another thin copper sheet taped down to my table that I'll be touching with my finger.
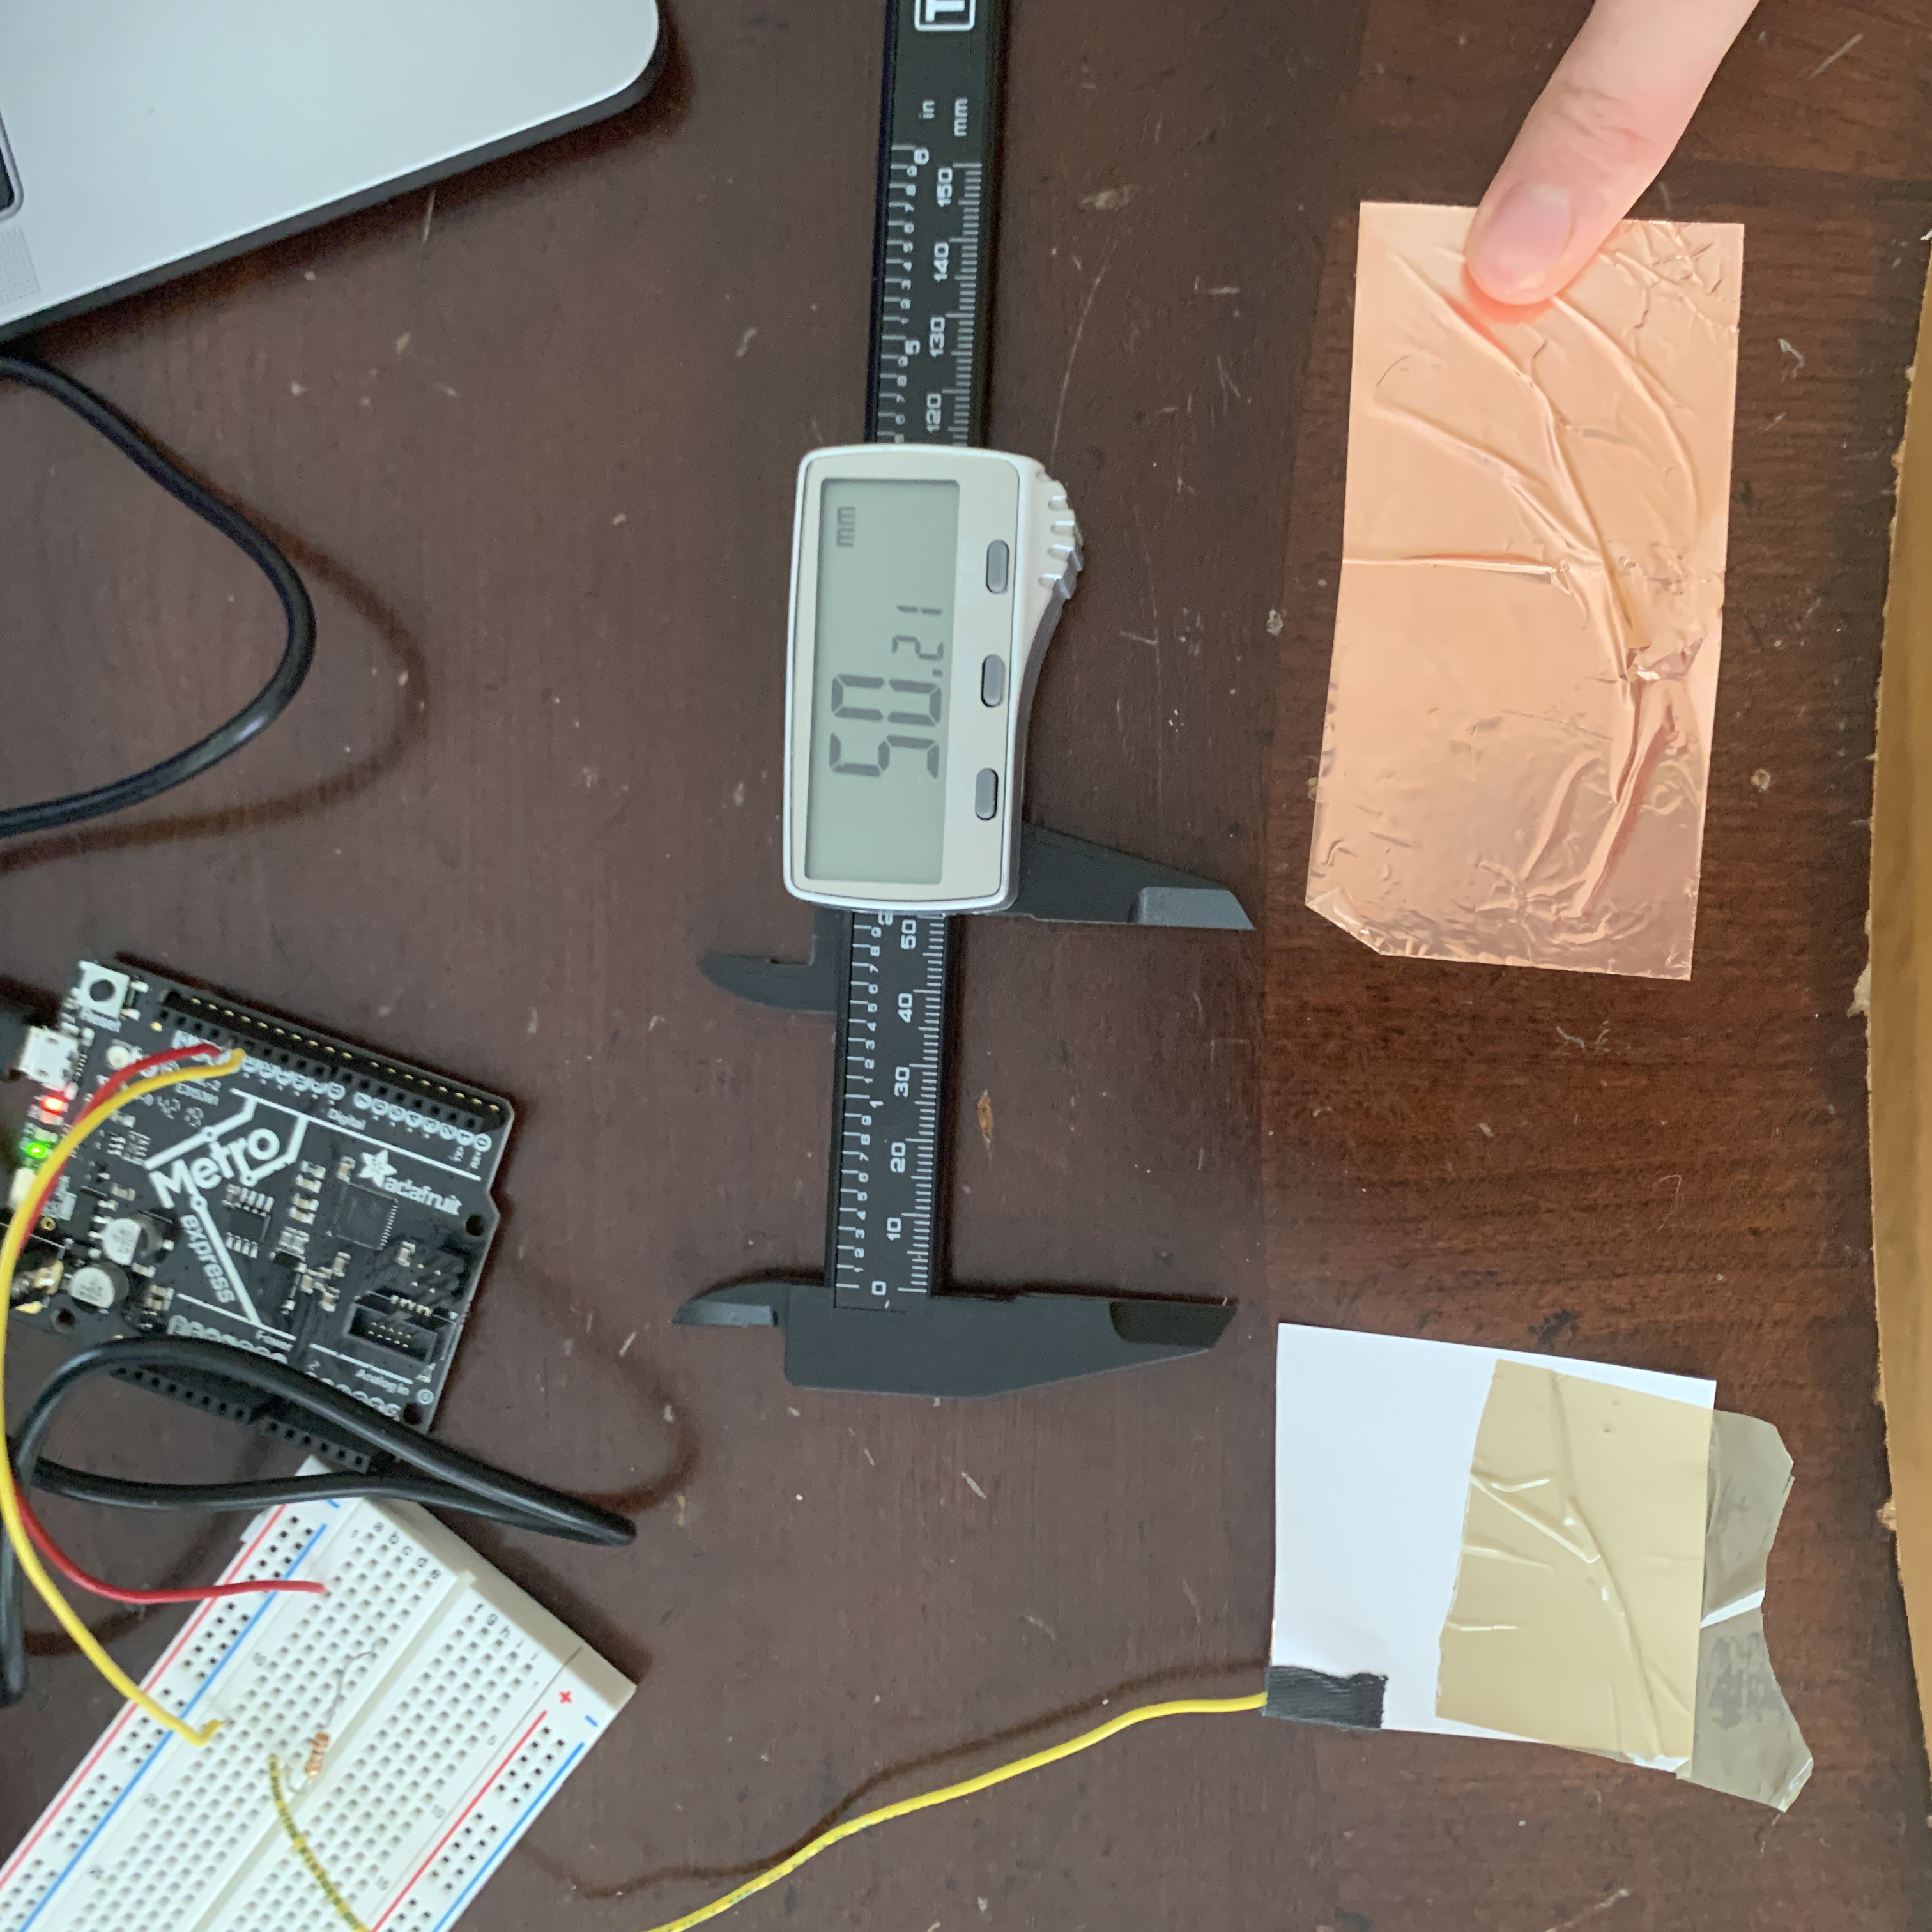
I will be measuring the relationship between the analog reading and the distance using the following code. Notice that I'm using the averaging method, which is what I used on the thermistor.
<
#include <CapacitiveSensor.h>

CapacitiveSensor Sensor = CapacitiveSensor(13,12);  //13 is charge pin.  12 is sense pin.

void setup() {
  Serial.begin(9600);
}

void loop() {
  long sensorValue = 0;
  for (int i = 0; i < 5; i++) { // get the average of 5 readings to smooth out the data
     sensorValue += Sensor.capacitiveSensor(1000);
     delay(10);
  }
  Serial.println(sensorValue/5);
  delay(100);
}
Here are the results:
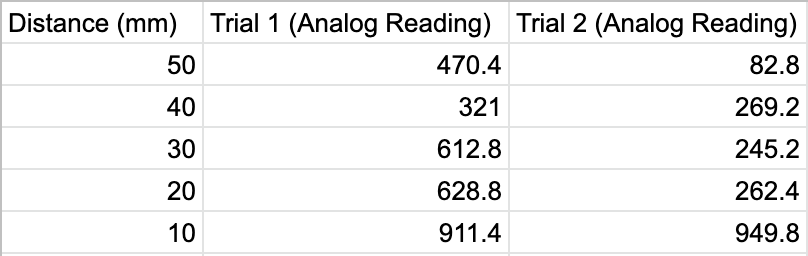
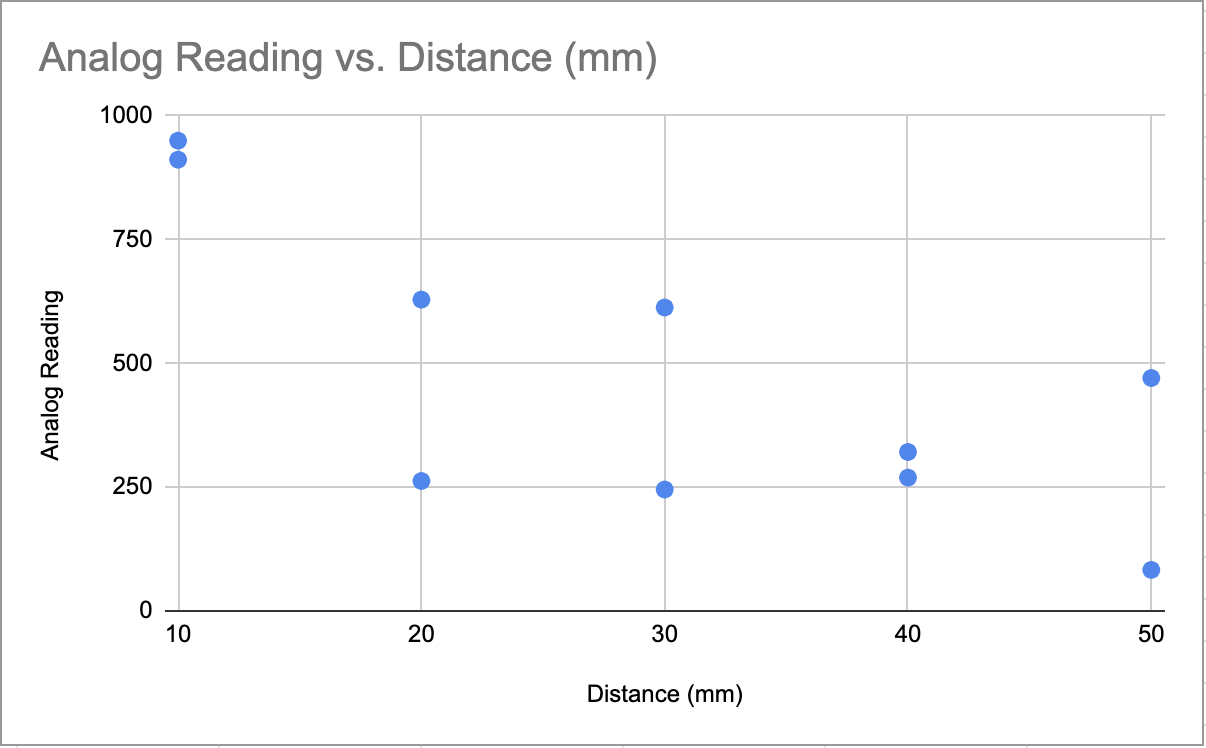
The data does suggest a trend, which is that analog reading increases as distance decreases. However, I'm afraid that is the most I can conclude from this set of data. This is because the data of the two separate trials are very far apart, suggesting that the readings are sporadic. If I had more time, I would definitely collect more data points in order to come up with a relationship between the Analog Reading and the Distance. Sadly, this is due on Thursday, and I spent all my time on the thermistor.